Current and Future Use of Real-World Data
Survey among readers evaluates the trajectory of RWD and how it can be more widely adopted.


As the clinical trials industry prepares for the final FDA guidelines on real-world data,* executives must consider how their organizations should invest in real-world data going forward.1 The COVID-19 pandemic has illustrated both the benefits and drawbacks of real-world data, accentuating the need for more information about how organizations should invest in these capabilities.
The decision to invest in real-world data is complex. Enthusiasts point to the benefits of real-world data, including the availability, efficiency, and generalizability.2,3,4,5,6 Skeptics of real-world data counter with the still uncertain regulatory environment and cite concerns about the quality, validity, reliability, relevance, costs, and provenance of the data.1,5,7 At the same time, the stakes are getting higher on these real-world data investment decisions; data is getting more expensive to acquire, curate, and protect.+ Achieving a positive return-on-data in this environment demands multi-functional collaboration on the use of the data across silos.
The first purpose of this research is to describe the overall current and future usage of real-world data. Real-world data usage is assessed within each of the functional areas (e.g. corporate strategy, trial design, site selection, or FDA submission) and then averaged into an overall usage score to get a view of how real-world data is being used across silos. We then examine the factors that drive real world data usage in two areas—the actual data as well as the data intermediaries/software providing that generate information from the data. The results of this analysis will help clinical trials make rational investments in real-world data.
Methods
We conducted descriptive research with purposive sampling of pharmaceutical and CRO executives. We solicited participation from readers of Pharmaceutical Executive and Applied Clinical Trials. Respondents were incentivized with a chance to win one of five $20 Visa gift certificates. The survey had 16 questions with some of the subsections having multiple items (total items = 143), including demographic items such as the type of organization (e.g., CRO or sponsor), size of organization, seniority, and role (e.g. clinical or commercial). Since this is descriptive research, respondents were allowed to skip questions to enhance the reliability of responses. The data was collected in September to October 2021. Some of the data management was conducted in Excel 365, version 2111 and data analysis was performed in SAS 9.4.
Our estimation of real-world data usage is cross-functional. Rather than asking for global assessments of real-world data, we asked respondents to assess real-world data usage within specific functions (corporate strategy, R&D, clinical trial design, site selection for clinical trials, patient matching for clinical trials, synthetic control—nonregulatory grade, health economic/outcomes research, FDA submission—basis for approval, FDA submission—supportive, market access—payer negotiations, post-approval safety studies, and other post-approval research). We then averaged usage across these functional areas to estimate respondents’ overall assessments of real-world data usage.
We organized our analysis into three areas each having a pair of questions: current and future usage of real-world data; importance of raw data attributes and satisfaction with data attributes; and the importance of and satisfaction with the characteristics of data intermediaries—including analytic vendors or consultants and software—used to provide and interrogate the raw data and generate information. The data attributes that we included were the presence of retrospective and prospective longitudinal data as well as biomarker data, and the ability to tailor the data and data dictionary and do chart reviews. The attributes of data intermediaries/software included the ability of the software platform to enable analytics and allow evaluation as well as their cost, reliability, problem solving, flexibility, responsiveness, and understanding of needs.
For each of these areas, we examine the mean scores for each of the items and create difference scores between current and future usage; data attribute importance and satisfaction; and data intermediary/software importance and satisfaction. These difference scores are important because they represent the potential growth of real-world data in the current/future usage or opportunities to grow in the gaps between importance/satisfaction. All variables used in significance testing had acceptable normality and met the assumptions for that statistical test.
Results
We had 133 responses after screening out respondents not in the sampling frame, abandoned surveys, or evidence of careless responding.8 The respondents came from a variety of types and sizes of organizations, seniority, and roles. Forty-two percent of the respondents worked at sponsors, 47% from CRO’s or functional service providers, and 11% from other (e.g. government agencies or non-profit advocacies). Thirty-seven percent of the respondents were from small companies (<100 employees), with 24% from medium sized companies (100-2,000 employees), and 38% from large companies (>2,000 employees). As for seniority, 24% of respondents were in the C-Suite, 10% were Vice Presidents, 29% were Directors, and 19% were managers. Finally, 47% of respondents had a clinical role, 32% had a commercial role, and 19% worked in a corporate role.
Current and future usage of real-world data
The average current usage of real-world data was a 5.8 on a range from 1 to 10. We found this to be a modest usage rating given the enthusiasm and amount of time real-world data has been available from EMRs. Current usage varied significantly (F2,116= 11.06, p< .001) by the type of organization, with CRO’s (μ= 6.8) having greater usage of real-world data than sponsors (μ= 6.0) or others (μ= 5.0). There was not a significant (F4,116= .88, p= .48) variation in the usage of real-world data based on the size of the organization or by the respondent’s role (F2,114= 1.31, p= .27) within the organization (i.e. clinical, commercial, or corporate). The functional area ratings for current usage are shown in the solid columns of Figure 1. The functional areas with the greatest current usage of real-world data were health economics and outcomes (μ= 6.8), post-approval safety (μ= 6.4), clinical trial design (μ= 6.4), and market access (μ= 6.3). Even within the functional areas with the highest usage, we still found these usage ratings to be relatively mediocre. The area with the lowest area of usage was non-regulatory synthetic control (μ= 4.4).


Figure 1. Current and future usage of real-world data broken out by function. The solid columns are current usage and the pattern-filled columns are future usage.
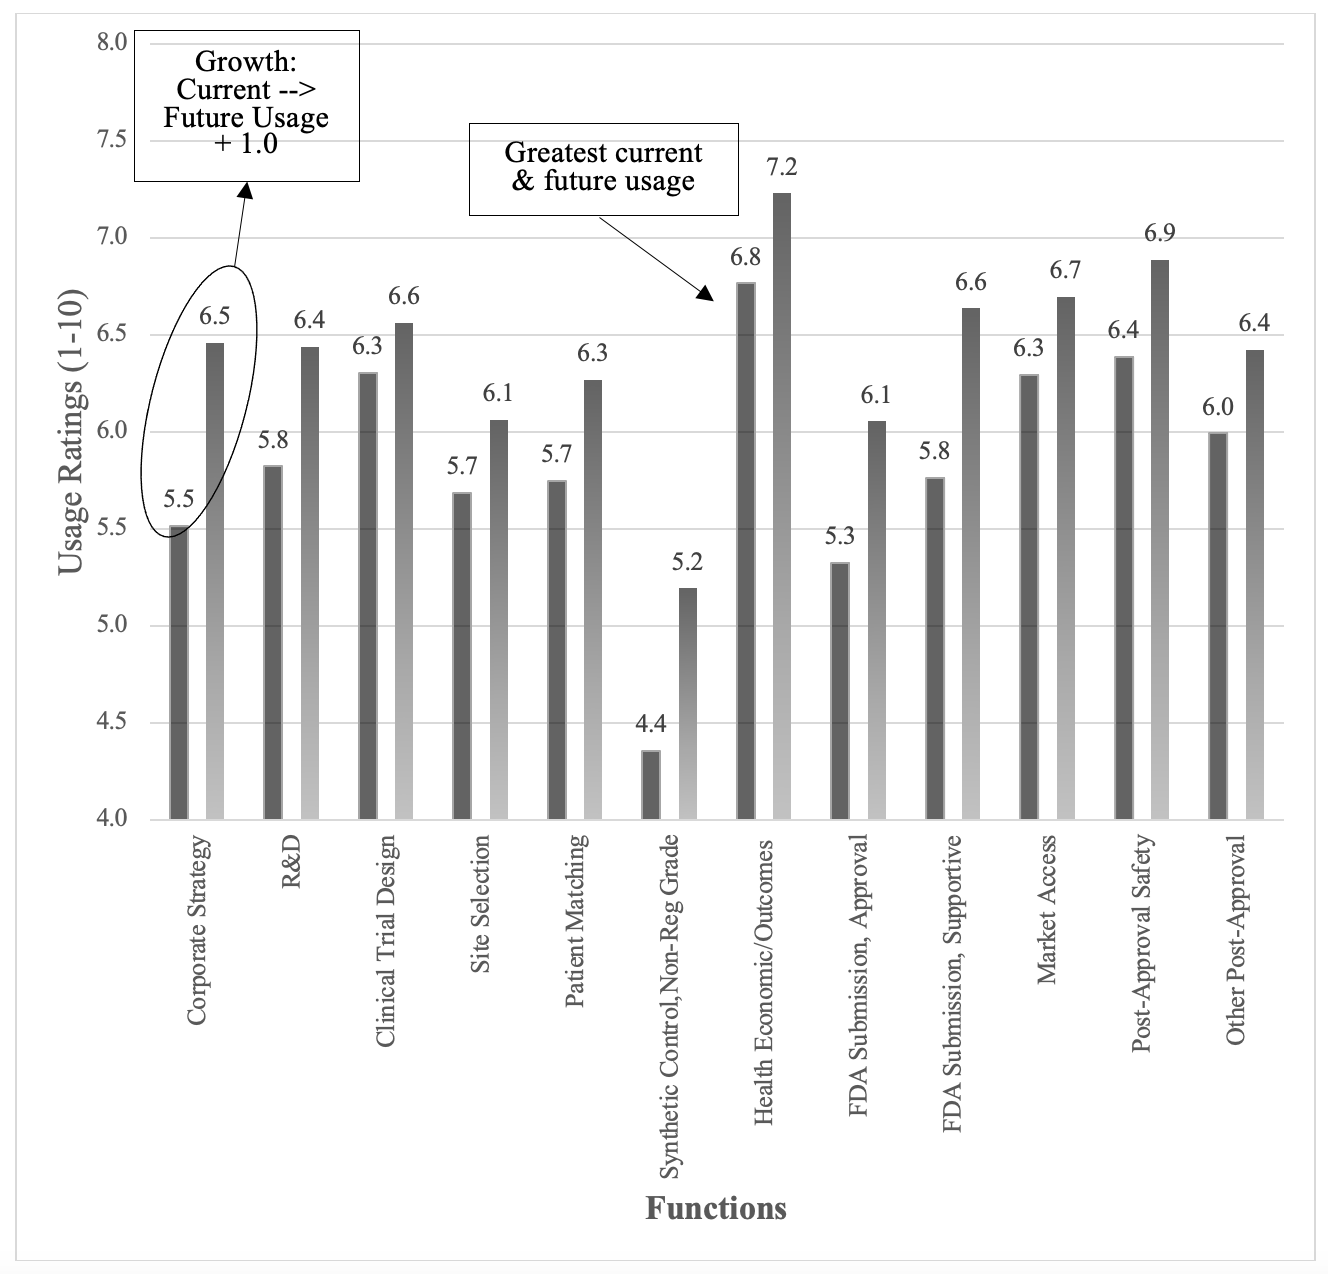
The anticipated future usage of real-world data was 6.4, or just 0.6 points higher than current usage, suggesting that respondents anticipated modest future usage of real-world data across all the functions. The future usage ratings are shown in the pattern-filled columns of Figure 1 above. There was no variation in future usage based on the size of the organization (F4,116= .78, p= .54) or the respondent’s role (F2,114= 1.31, p= .27) but there was significant variation based on the type of organization (F2,118= 8.16, p= .005), with CROs (μ= 7.2) anticipating greater future usage of real-world data compared to Sponsors (μ= 6.7) or the group of Others (μ= 5.3). The future usage ratings within each of the functions were similar to the current usage, with Health Economics/ Outcomes (μ= 7.2), Post-Approval Safety (μ= 6.9), and Market Access (μ= 6.7) having the greatest future usage and Synthetic Control (μ= 5.2) having the lowest future usage.
The differences between current and future usage ratings provide insights on the potential growth of real-world data and are shown in the line graph of Figure 1. All of the differences were quite small, with average of all the differences being .6 on a 1 to 10 scale. One perspective could be that these relatively small differences suggest limited growth for real-world data. The greatest opportunities for real-world data growth were in the areas of corporate strategy (Δ= .86) and supportive FDA submissions (Δ= .85), as shown in Figure 3.
Data attribute importance
We next focused on the characteristics of the raw data that drove the adoption of real-world data, looking at the importance of the data characteristics first. The overall importance of the data characteristics was a mean of 7.3 on a scale of 1 to 10. There were no significant differences based on the type of organization (F2,129= 2.02, p= .13), size of the organization (F4,127= 1.24, p= .30), seniority (F4,127= .15, p= .96), or role (F2,127= .54, p= .58). The scores for the specific functional areas covered a fairly narrow range of .8, suggesting that the specific characteristics are either relatively equal or difficult to evaluate to these executives. The importance ratings for the various functional areas are shown in the solid columns of Figure 2 below. The most important attributes were the presence of retrospective and prospective longitudinal data, analytics support, and the ability to tailor the data, also shown below in Figure 2.


Figure 2. Data attribute importance and satisfaction ratings broken out by data attribute. Solid columns are the importance ratings. Pattern-filled columns are the satisfaction ratings. The average difference between importance and satisfaction was -1.2.
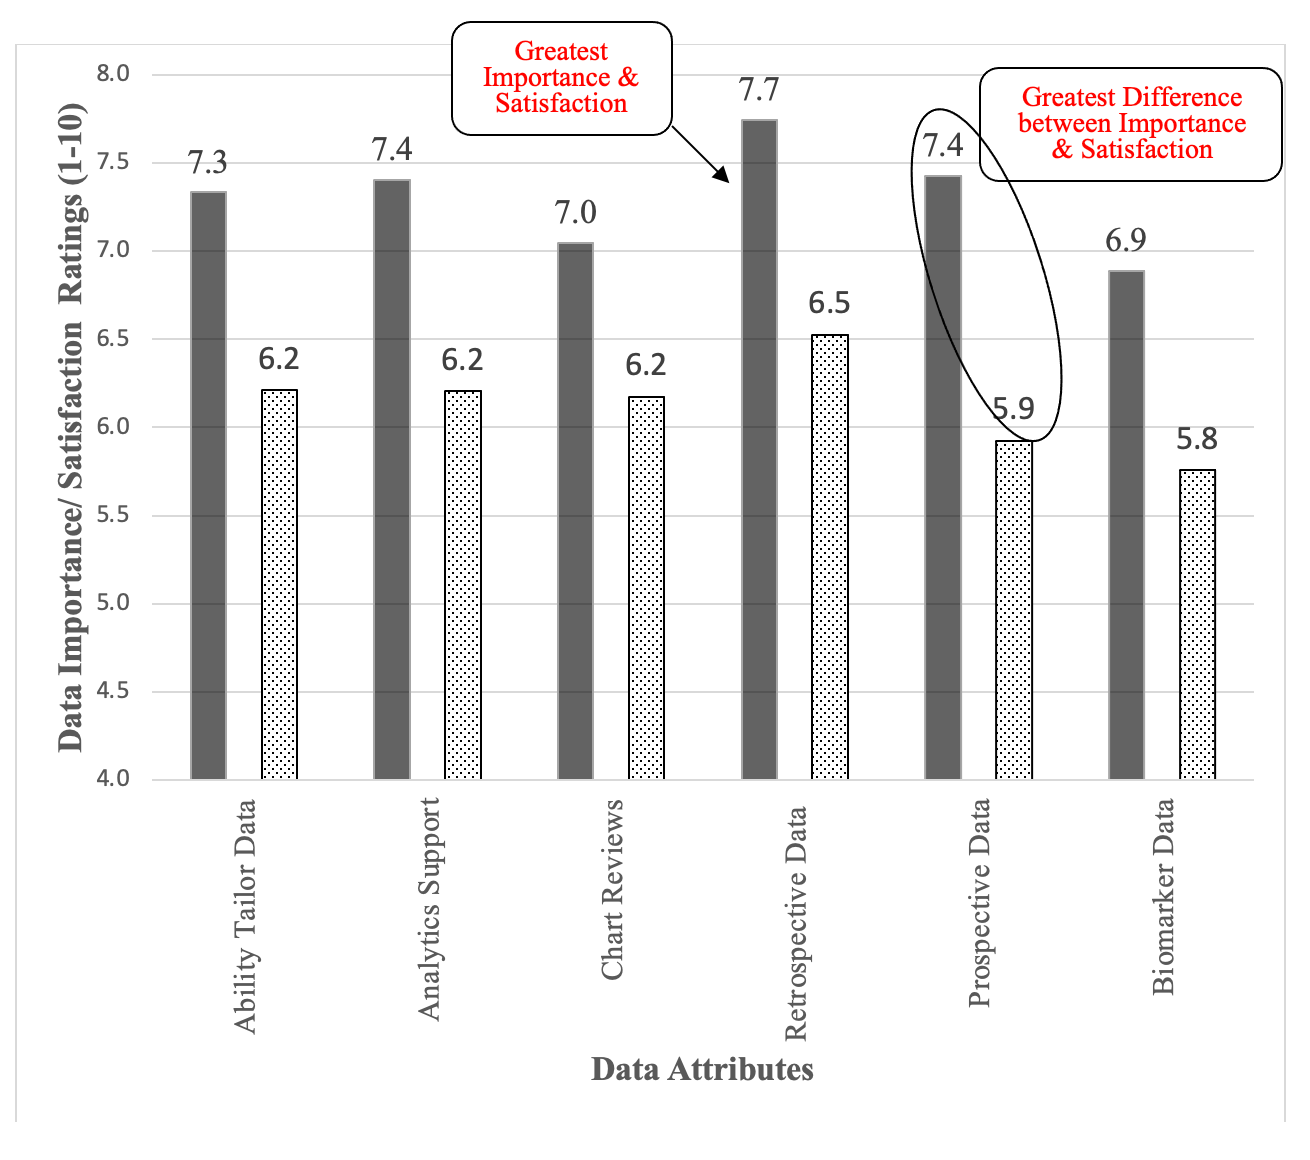
The overall satisfaction with the data attributes was 6.1 (Range 1 – 10), compared to the mean of 7.3 for the importance of these attributes. Satisfaction with the raw data was .9 of a point (on a scale of 1 to 10) below importance, suggesting an opportunity for improvement in the raw-data attributes. There were no differences based on the type of organization (F2,73= 2.68, p= .08), size of the organization (F2,71= .43, p= .78), seniority (F4,71= .40, p= .80), or role (F2,72= .99, p= .37). It is interesting to see the drop-off in responses to this section, as can be seen in the second number in the degrees of freedom. We did not force completion of any responses, so this drop-off suggests that our respondents felt less qualified to evaluate the data attributes. Within the specific attributes, satisfaction was highest on tailoring the data, the availability of retrospective and prospective data but struggled the most with chart reviews and biomarker data, as shown in the pattern-filled column of Figure 2.
We again compared the difference between the importance of data characteristics and satisfaction. These difference scores provide insights on how to improve usage of real-world data. The average difference between the rated importance of the various data attributes and The line graph in Figure 2 shows the difference between the rated importance and satisfaction for each of the attributes. None of the data attributes had satisfaction scores that were above the rated illustrating the gap between satisfaction and importance.
Data intermediaries/software attributes
The area we considered as a driver of real-world data usage focused on the data intermediaries/software platforms that enable access to the data. The overall mean for the importance of data intermediary/software attributes was 7.9, which was higher than the overall mean for the data attributes (μ= 7.3). There were no differences in importance based on the type of organization (F2,128= .35, p= .70), size of organizations (F4,126= 1.0, p= .41), seniority (F2,126= .58, p= .68), or role (F2,126= 1.41, p= .26). The functional breakouts for the data intermediaries/software are shown in the solid columns for Figure 3. Note the higher degrees of freedom from the higher response rate, suggesting these executives found it easier to evaluate the data/software intermediaries.


Figure 3. Data Intermediary/ Software attributes. The importance ratings are in the solid column and the software rates are in the pattern-filled column.
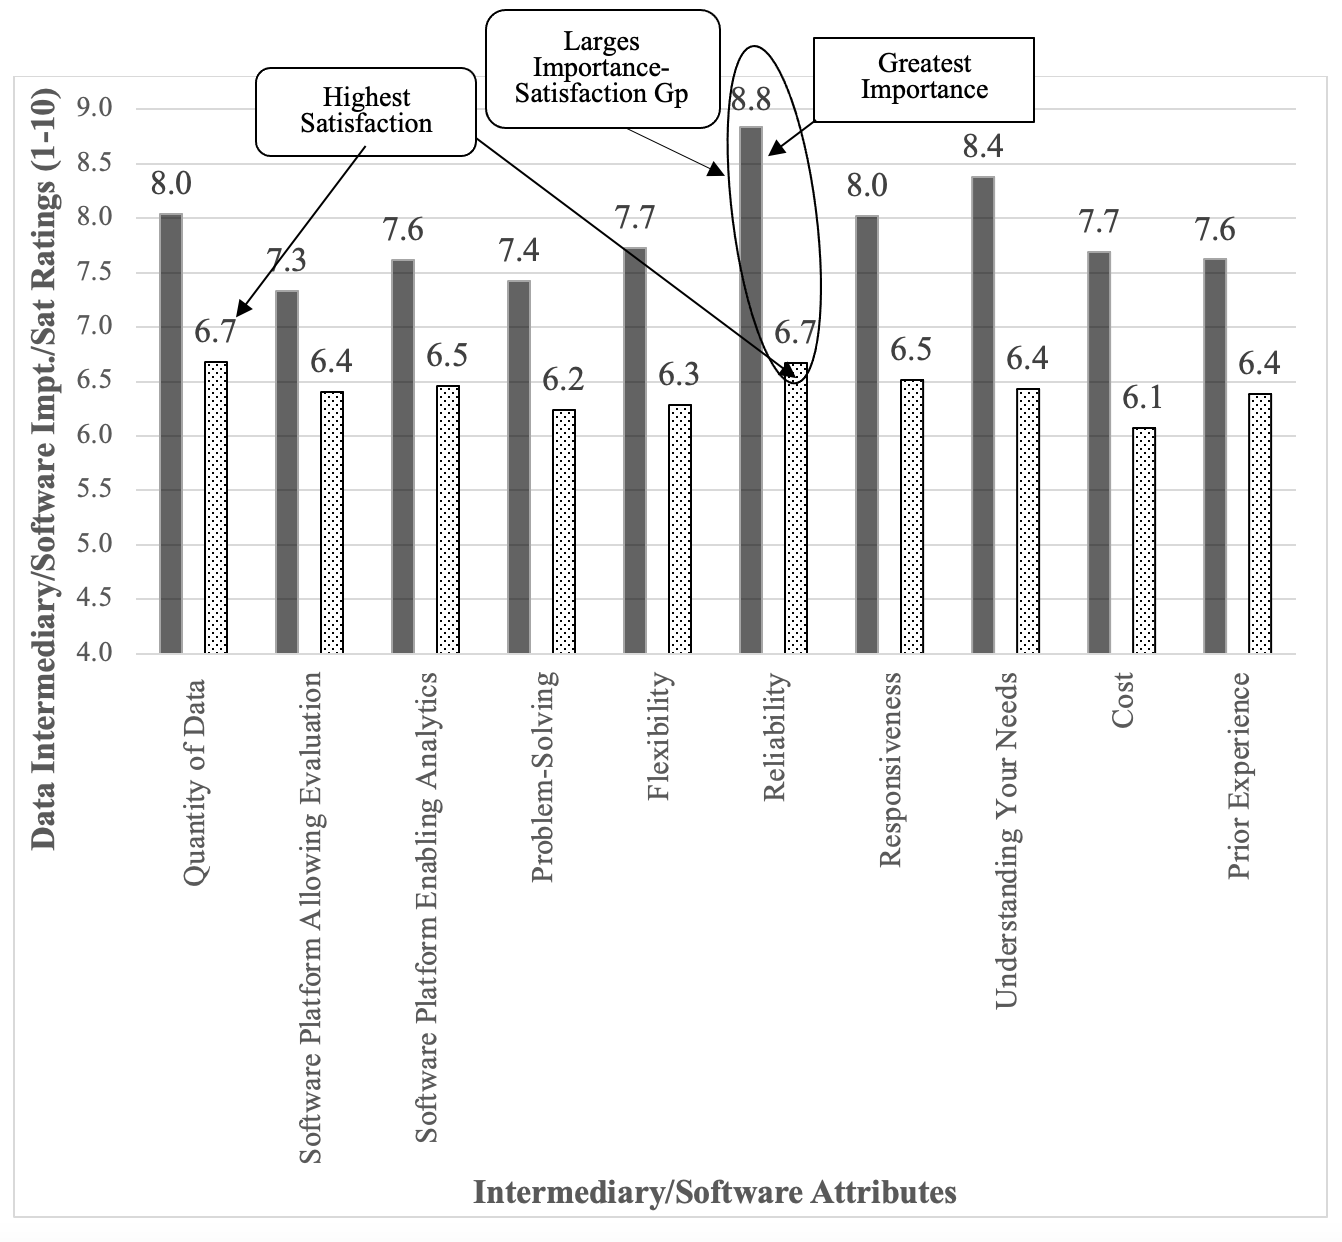
The satisfaction with the data/software attributes was 6.4, quite a bit less than the importance average of 7.9. There were no differences seen for type of organization (F2,125= 1.55, p= .22), size of organization (F2,123= .98, p= .42), seniority (F2,123= .26, p= .90), or role (F2,123= 1.37, p= .26). The satisfaction of the data intermediaries/ software attributes are shown in the pattern-filled columns of Figure 3 above.
The difference between the attribute importance and the satisfaction illustrates the potential for improving real-world data adoption/usage by narrowing this gap. Software platforms had the highest gap (μ= 1.5), suggesting a greater opportunity for growth in real-world data usage compared to data (μ= 1.0). The greatest differences (or opportunity for growth) were seen in the intermediary/software reliability, cost, responsiveness, and understanding of needs.
Summary of results
- Current usage of real-world data was mediocre (μ= 5.8) across all functional areas but was highest for health economics/outcomes research, post-approval safety studies, and clinical trial design.
- Anticipated future usage of real-world data (μ= 6.4) was slightly higher, with the greatest growth opportunities in corporate strategy, supportive FDA submission, and synthetic control. FDA approval came in a distant fourth.
- The importance of the software platforms (μ= 7.9) was rated as being more importance that the actual data (μ= 7.3).
- The greatest opportunities to improve real-world data usage came in the area of data/intermediaries/software platforms.
- Intermediaries/software was rated as being more important,
- The difference between the importance and satisfaction was greater for the software platforms (Δ= -1.5) than for data (Δ= -1.1), suggesting a greater opportunity for growth.
Discussion
The prominence of real-world data grew rapidly from the publicity and success of its use during the COVID pandemic, the update to the FDA guidance, and a global market expected to grow at 14.4% (MarketsandMarkets, 2022). The results of this study temper that enthusiasm by demonstrating that overall real-world data usage and perception of its value is at mediocre levels with limited potential for growth seen by industry executives. The satisfaction gap with both raw data attributes and the intermediaries/software options are perhaps more of a concern. Part of this satisfaction gap may result from higher expectations related to the effort and money necessary to create real-world datasets now.* For those interested in achieving greater usage of real-world data, our results suggest focusing on the intermediaries and, in particular, the software that interrogate the raw data to generate information.
The findings on mediocre usage of real-world data align with the 2017 Deloitte survey demonstrating about half of companies are investing in real-world data. Our research extends this finding by examining usage across functions. These usage findings also align with the challenges that health care providers and the general business community are having with using real-world data in health services (Goo, Huang, & Koo, 2015; Howley, Chou, Hansen, & Dalrymple, 2015). As a CEO once told the second author, “I get the importance of data systems and I am willing to write large checks for them. But I have been disappointed in the return in those investments.” (Baynham, 2005). Viewed from this lens, then, the usage findings may suggest that real-world data in the clinical trials is performing at an above-average level.
These return-on-data dynamics are at the core of this analysis. On one hand, acquiring and curating data is now a centralized function of the organization that has become very expensive. This has sharply increased the denominator for any return-on-data calculations.* Organizations must improve their return-on-data by using data across more functions.. Different areas still have different data requirements and standards, but different functions are becoming more open to extracting information from the centralized data. To improve the numerator of the return-on-data calculations.
The results of this research suggest limited growth for real-world data usage absent meaningful changes to practical aspects associated with its use. The anticipated future usage was less than 1-point higher than current usage. We recognize this contrasts with expected market growth of 14% annually.9 In part, this may reflect the differential between the quantity of use and the anticipated cost of obtaining and working with the data. For example, executives we spoke to about these results point to the complexities of curating the data. Acquiring a large dataset is one thing, but wrapping that data in an ecosystem that makes that data usable is a more difficult challenge.+ The challenge today for real-world data is how to create that ecosystem to extract the value from the data.
In summary, we see the path forward for real-world data pivoting on three issues. First, the industry must continue to build a business case for real-world data beyond FDA approval across the other functions. The value of its use in R&D strategy, protocol development, clinical trial participation, HEOR, and commercialization is increasingly clear. However, the future for RWD as a primary basis for FDA approval based on real-world is significantly less established and remains unclear. Nonetheless, progress is being made as the FDA continues to accept real world-evidence based on RWD as supportive and supplemental to submissions.
Second, can the quality of the data be maintained and standardized across all functions, which have different data requirements, and often source data independently (though there are indications that is beginning to change). While this evolution must continue, the data must maintain the required validity and reliability across all applications.
Third, as large and integrated data sets become the norm, development of low-code or no-code tools by which managers can interrogate the data and yield reliable insights is critical. Otherwise, the utility of the data is significantly reduced if the ability to analyze and interrogate it becomes too burdensome. As real-world data spreads across the functions, can we accommodate a variety of data analytic skills?
Last, data providers must examine the low-scoring aspects of their offerings to determine how better their customers can be served beyond just continuing to improve overall data quality. The breadth of dissatisfaction is too great to leave unaddressed.
The limitations of this study should be kept in mind in interpreting these results. Our approach to assessing overall real-world data usage by averaging across functions is different and potentially could skew to the downside. On the other hand, this provides a unique perspective on the breadth of real-world data usage and not just the depth. For real-world data to have a meaningful impact on clinical trials, it should be used across multiple functions. This is a cross-sectional online sample of executives, which could result in bias. We attempted to offset this as much as possible with a careful careless responding analysis. This survey also takes place at a specific context and point-in-time. We believe, however, that this is a propitious time to understand the industry sentiment of real-world data. Finally, the organizations we sampled used real-world data across multiple therapeutic areas. This is becoming increasingly common+ as these datasets become more expensive. Future researchers interested in the influence of therapeutic area should consider the role of organizational capabilities on real-world data usage.
Conclusion
Although real-world data enjoys broad enthusiasm, the decision for companies on whether and how to invest in real-world data is complex and ambiguous. This research provides a context for these decisions by showing how real-world data is being used across the clinical trials industry. We find that real-world data usage is at mediocre levels with limited potential for growth. The path to greater uptake of real-world data is through the data intermediaries/software, which are seen as more important than the actual data and have a greater discrepancy between the rated importance and satisfaction. Focusing on the data intermediaries/software should allow for greater adoption of real-world data and greater breadth of usage across the functions.
Author’s Notes: 1) Both authors contributed equally in the creation of this manuscript. 2) We are grateful to the participants of the Pharmaceutical Executive Roundtable participants who discussed these issues with us on March 10, 2022 and the other clinical trials executives who provided insights into our findings. Their contributions are denoted with a + in the manuscript.
*In this paper, we consider the terms ‘real-world data’ and ‘real-world evidence’ to be equivalent constructs.
Michael Howley, PA-C, MBA, PhD, Clinical Professor, LeBow College of Business, Drexel University, Peter Malamis, MBA, Senior Director, Market Development, Phreesia, Inc.
References
- FDA. (2021). Considerations for the Use of Real-World Data and Real-World Evidence To Support Regulatory Decision-Making for Drug and Biological Products: Draft Guidance for Industry.Retrieved from https://www.fda.gov/regulatory-information/search-fda-guidance-documents/considerations-use-real-world-data-and-real-world-evidence-support-regulatory-decision-making-drug.
- Nazha, B., Yang, J. C., & Owonikoko, T. K. (2021). Benefits and limitations of real-world evidence: lessons from EGFR mutation-positive non-small-cell lung cancer. Future Oncology, 17(8), 965-977.
- Pearson, R. M. (2021, November 12, 2021). Real-world data on the safety of covid shots for young children is just weeks away. Washington Post. Retrieved from https://www.washingtonpost.com/opinions/2021/11/12/real-world-data-safety-covid-shots-young-children-is-just-weeks-away/
- Rudrapatna, V. A., & Butte, A. J. (2020). Opportunities and challenges in using real-world data for health care. The Journal of Clinical Investigation, 130(2), 565-574.
- Sherman, R. E., Anderson, S. A., Dal Pan, G. J., Gray, G. W., Gross, T., Hunter, N. L., . . . Robb, M. A. (2016). Real-world evidence—what is it and what can it tell us? In (Vol. 375, pp. 2293-2297): Mass Medical Soc
- Sundgren, M., Kaj Stenlöf MD, PhD, Lollo Eriksson, PhD, . (2021). Using Real-World Data in Patient Recruitment. Applied Clinical Trials, 30(4).
- Wechsler, J. (2021). FDA Acknowledges Hurdles in Utilizing Real World Data. 30(11).
- Meade, A. W., & Craig, S. B. (2012). Identifying careless responses in survey data. Psychological methods, 17(3), 437.
- MarketsandMarkets. (2022). Real World Evidence/RWE Solutions Market by Component (Dataset (Claims, Clinical, Pharmacy, Patient), Services), Therapeutic Area (Oncology, Cardiovascular, Neurology), End User (Pharma, Medtech, Payers, Providers) Covid-19 Impact - Global Forecast to 2026. Retrieved from https://www.marketsandmarkets.com/Market-Reports/real-world-evidence-solution-market-76173991.html


, broader use of real-world evidence (RWE), decentralized clinical trials (DCTs), master protocols, risk-based quality monitoring (RBQM), and precision medicine are shaping the future of research.")
Effect of AI/ML, Real World Evidence and Master Protocols on Trial Success
July 7th 2025How the application of artificial intelligence, broader use of real-world evidence, decentralized clinical trials, master protocols, and risk-based quality monitoring, together with strong ethical oversight and increased collaboration, are contributing to better healthcare delivery and strengthening the role of clinical research in driving global health progress.


The Importance of Real-World Evidence in Medical Research and Drug Development
February 18th 2025The ongoing evolution of real-world evidence from a novel concept to a cornerstone of modern medical research signifies its growing importance and vast potential to improve personalized medicine, overall healthcare outcomes, and eventually democratization of scientific facts by general accessibility.