The Eradication of False Signals in Monitoring
How optimizing RBQM risk detection reduces the efforts caused by false signals.


Risk-based approaches to monitoring clinical trials were brought to the forefront with an FDA guidance published in 2013.1 This guidance was motivated by the steadily increasing complexity, size, and volume of clinical trials, and a recognition that “traditional” monitoring was very resource intensive and that emerging technologies and statistical approaches enabled monitoring in new ways. The FDA was prescient, as the industry has continued to witness a steady increase in the complexity, cost, and burden of clinical research. And with complexity comes ever-greater challenges to achieving quality outcomes. An analysis of new drug applications submitted to FDA was published in 2014, indicating that quality-related issues were a significant contributor to both failed submissions and delays in marketing approval.2
Risk-based monitoring (RBM), a key component of risk-based quality management (RBQM), was subsequently incorporated as a good clinical practice (GCP) expectation in the ICH E6 (R2) guideline and is now being widely adopted across the pharmaceutical industry. RBQM and RBM have brought a tremendous opportunity to improve data quality, increase resource efficiencies, lower costs, and shorten clinical development timelines. It enables a more effective anticipation, mitigation, and management of risks to ensure the successful conduct of clinical trials.
The approach to implementing RBQM is crucial to its success, and the process can be overwhelming for an organization given the wealth of the available information and variety of the options. Some organizations have struggled to move forward effectively due to a range of factors. This article focuses on a key component of the RBQM process, namely the effective detection and resolution of risks through centralized monitoring. Reliable risk detection is explained in the context of false and true risk signals, and best practice considerations discussed to ensure optimal quality oversight.
Understanding false and true signals
Centralized monitoring has rapidly become a key component of quality oversight during the execution phase of clinical research. The purpose of centralized monitoring is the detection of emerging risks that may represent issues in the conduct of the study that need to be addressed. The most common centralized monitoring tools employed include statistical data monitoring, key risk indicators (KRIs), and quality tolerance limits (QTLs), along with supportive data visualizations. Each of these tools is designed to alert study teams to patterns of data that are outside of an expected range, which increases the likelihood that those data are unreliable and/or that the study conduct processes associated with those data need to be corrected or improved.
What centralized monitoring tools do not generally provide is a definitive confirmation that data is unreliable and/or that there is an issue with certain aspects of study conduct. The alerts—typically referred to as risk signals—instead represent a way to focus the study team’s attention more intelligently to possible issues. It is then the responsibility of the study team—or assigned members of the study team—to assess each risk signal and ultimately determine whether the signal represents an actual issue needing intervention. The effectiveness of centralized monitoring therefore depends on two key factors:
- Reliable detection of risk signals that matter.
- The ability of the study team to successfully assess and determine the root causes and address confirmed issues effectively.
So, what exactly does reliable risk detection mean? We can organize the outcome of risk detection efforts into four logical categories:
- True positives - Risk signals (alerts) generated that correctly identify actual issues that matter.
- True negatives - The appropriate absence of risk signals where no issues that matter exist.
- False positives - Risk signals (alerts) generated that do NOT identify issues that matter.
- False negatives - The inappropriate absence of risk signals where actual issues that matter DO exist.
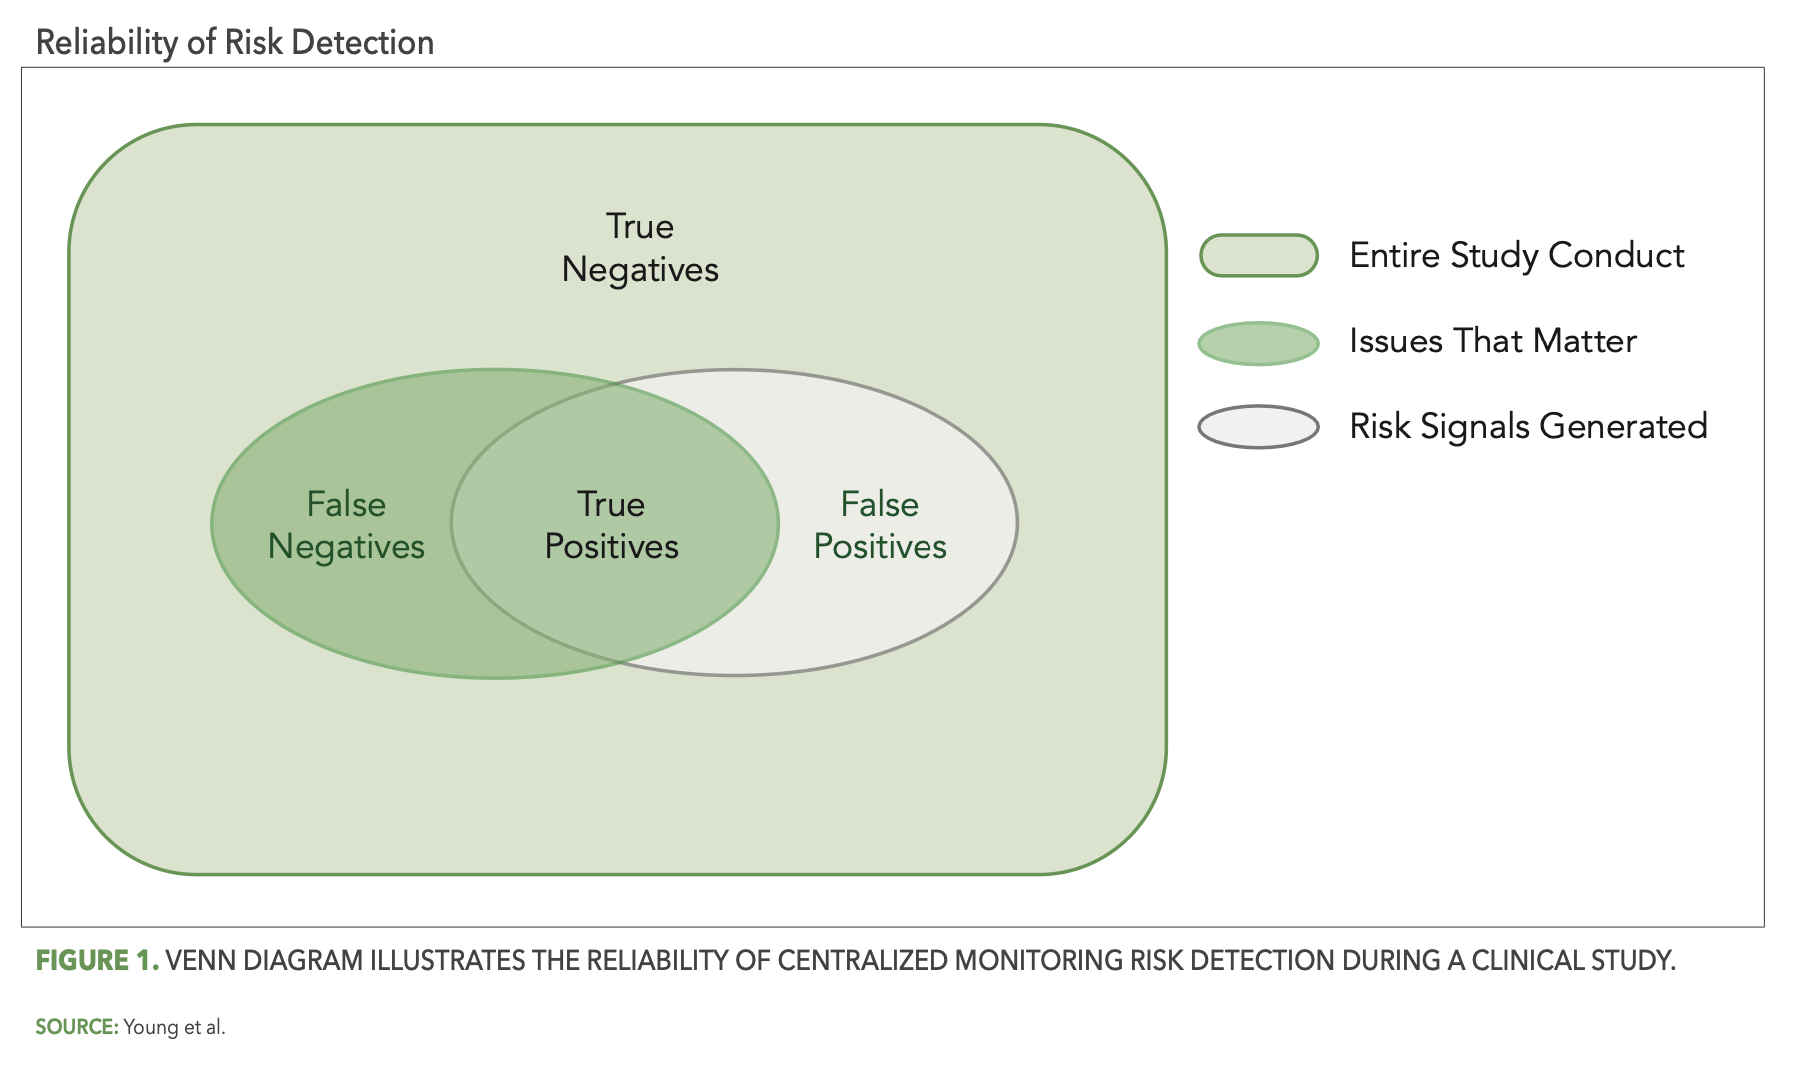
In this context, risk detection efforts become more reliable to the extent that they maximize the occurrence of true positives and true negatives and minimize the occurrence of false positives and false negatives. Figure 1 below uses a Venn diagram to depict the reliability of centralized monitoring risk detection during a trial. The box shaded in light green represents the entirety of study conduct across all sites and participants for a given trial. There is within any given study some “issues that matter,” and this is represented in the figure by the dark green-shaded oval inside of the study box. The centralized monitoring tools used for a study will generate a set of risk signals associated with certain sites, processes, and/or data within the study, and this is represented by the gray-shaded oval. The area of overlap between the two ovals are the true positives—the risk signals that successfully identified issues. The remaining non-overlapping areas of the two ovals represent the central monitoring “misses,” the gray area comprising false positives and the dark green area comprising false negatives. The remaining dark green area outside of the two ovals then represents all the true negatives, where no issues exist and were appropriately not identified by central monitoring.


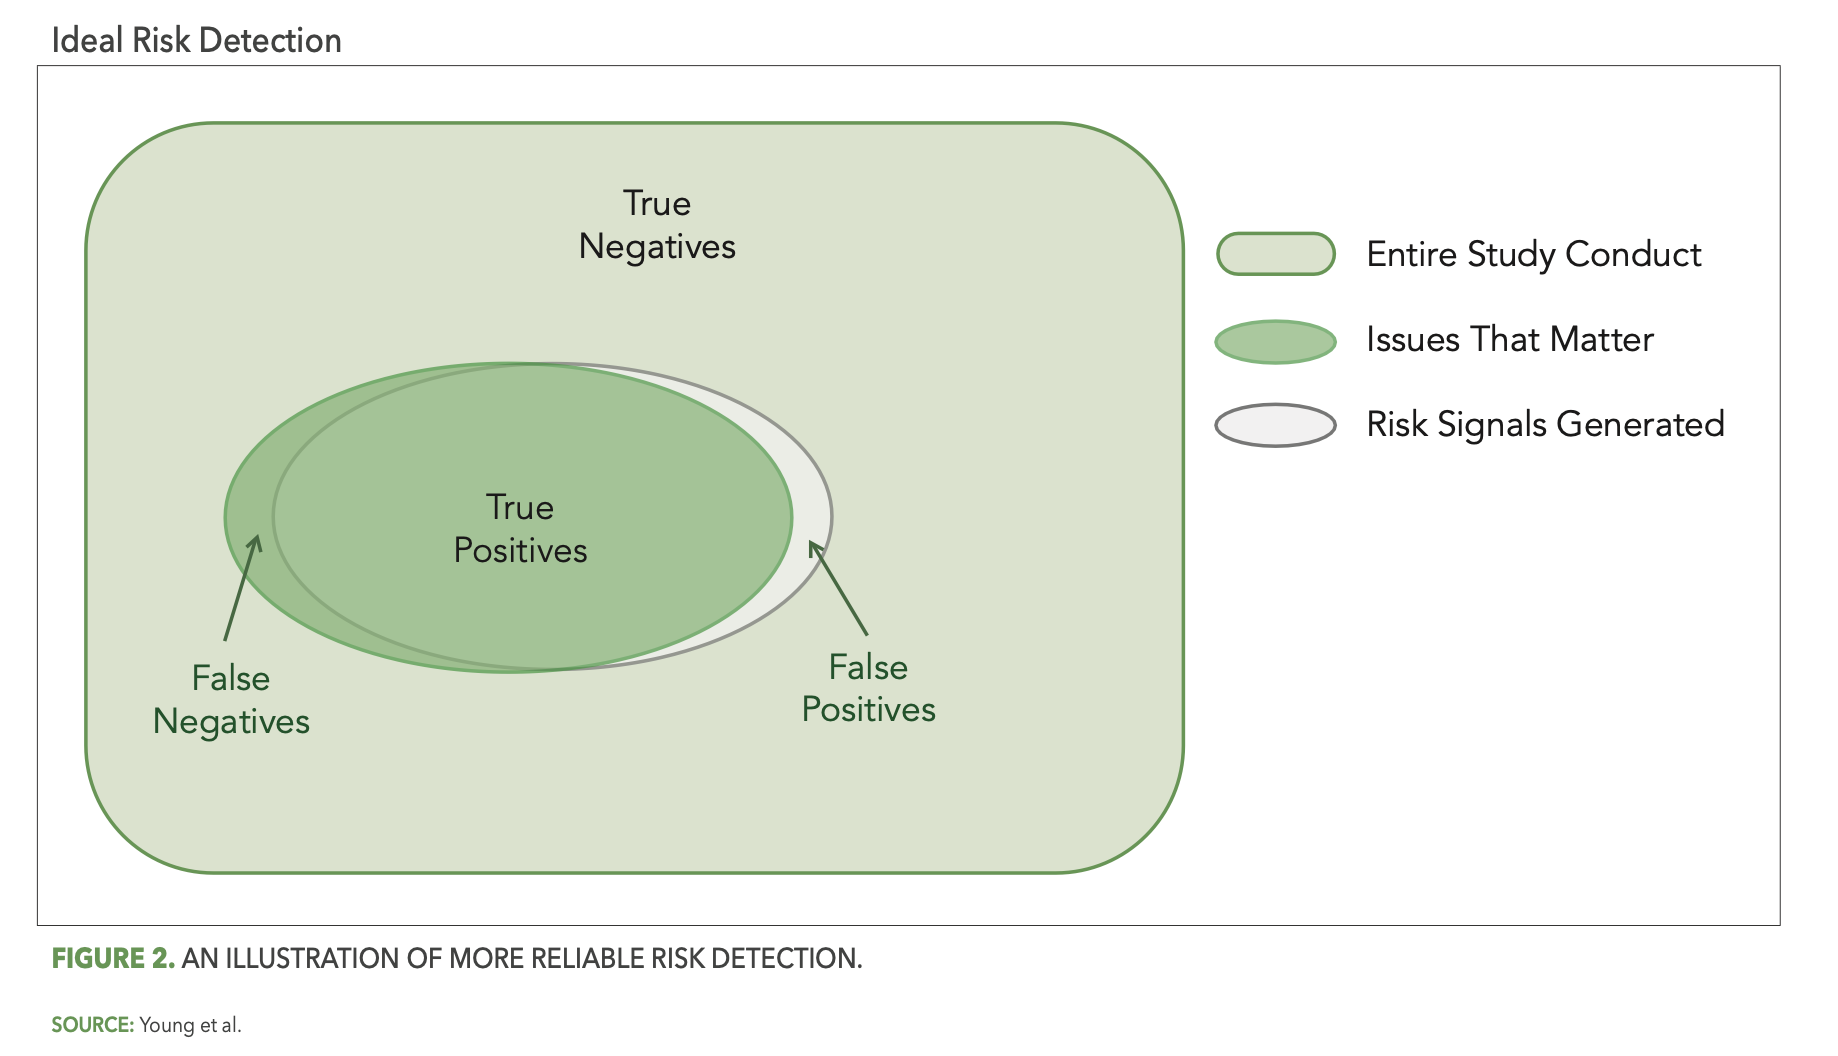
More reliable risk detection is then achieved as the gray oval (risk detection) more completely covers the green oval (issues that matter), as illustrated in Figure 2 below.


The importance of reliable risk detection is two-fold. First, false positives represent resource effort spent by the study team to review and possibly investigate risk signals that turn out to be non-issues. The more false positives there are, the greater the amount of time and effort spent on unimportant matters. Second, and perhaps more importantly, false negatives represent issues in the study that may remain unaddressed and, therefore, have the potential to negatively impact the reliability of study outcomes or patient safety.
It is clear, then, that the relative reliability of your centralized monitoring solution in detecting risk is fundamentally important to ensuring effective quality oversight. It is not enough to simply implement some basic centralized monitoring tools and processes. Those tools and processes must be reliable at identifying the issues that matter within the conduct of your clinical trial and minimizing the occurrence of false signals.
Eradicating false signals
Quality by design and pre-study risk planning
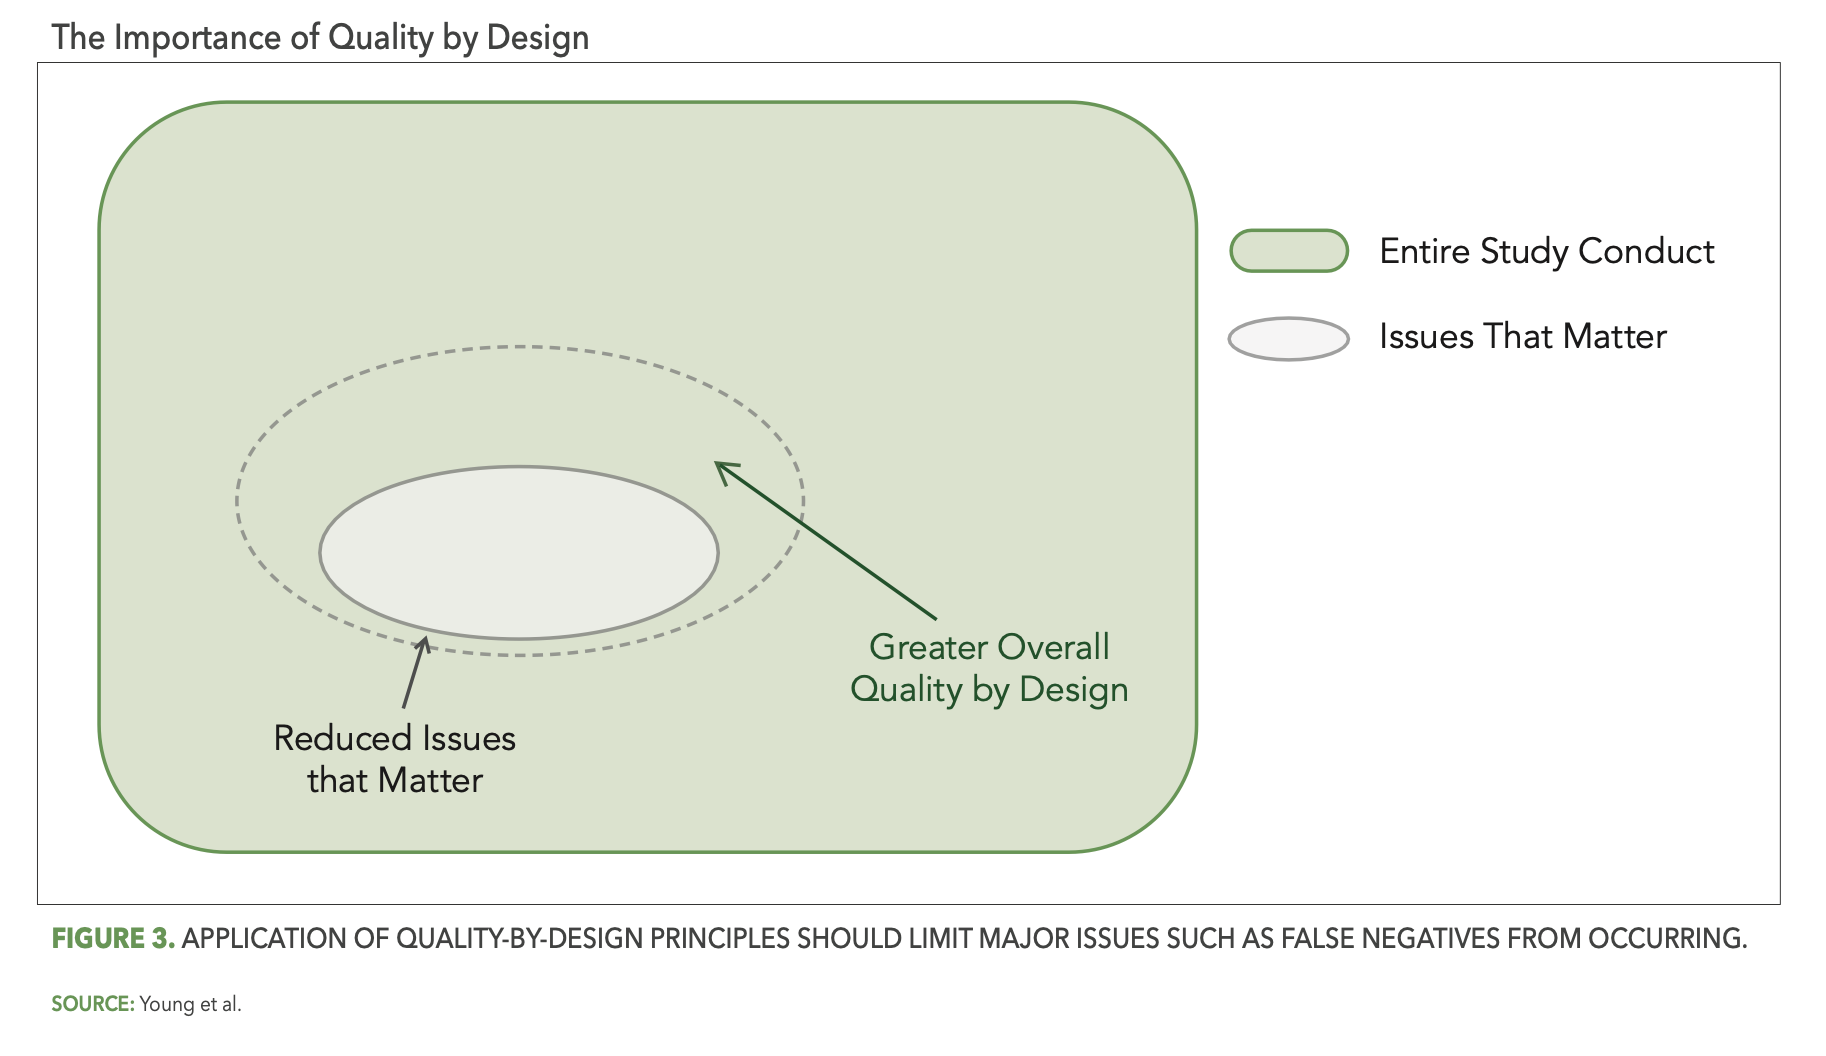
So how do we achieve optimal reliability? While there is no single silver bullet solution to eliminate all false signals, there are indeed several important best practice considerations. The first of these focuses on the study design and pre-study planning components of RBQM methodology. In particular, the effective application of quality-by-design (QbD) principles as described in the ICH E8 (R1) guideline3, including assessment and mitigation of risks associated with critical-to-quality (CtQ) factors, should reduce the opportunity for issues that matter to occur during the study. In the context of our Venn diagram and as depicted in Figure 3 below, QbD should shrink the overall size of the gray oval (issues that matter), thereby automatically reducing the opportunity for false negatives and increasing overall study quality (the light green area).


This is, of course, true not just for QbD, but for pre-study risk planning as well. Here as well the goal is for the study team to identify the operational risks that are most relevant (i.e., likely to occur, impactful) to the planned study, and once identified to put in place control measures that reduce the opportunity for issues that matter to occur (i.e., further shrinking the light gray oval) and minimize the impact when issues do occur.
These risk control measures—commonly referred to as risk mitigations—may include preventive actions such as delivery of additional targeted training for new and/or complex study procedures. They should also include the identification of mechanisms for the effective monitoring and detection of the relevant risks during study conduct. It is important to select appropriate key risk indicators (KRIs) and quality tolerance limits (QTLs) that will be used in the centralized monitoring process. If the risk assessment process is ineffective and the wrong risks are identified by the study team, the resulting KRIs and QTLs used to detect those study risks will likely not detect any issues of importance.
KRI and QTL effectiveness
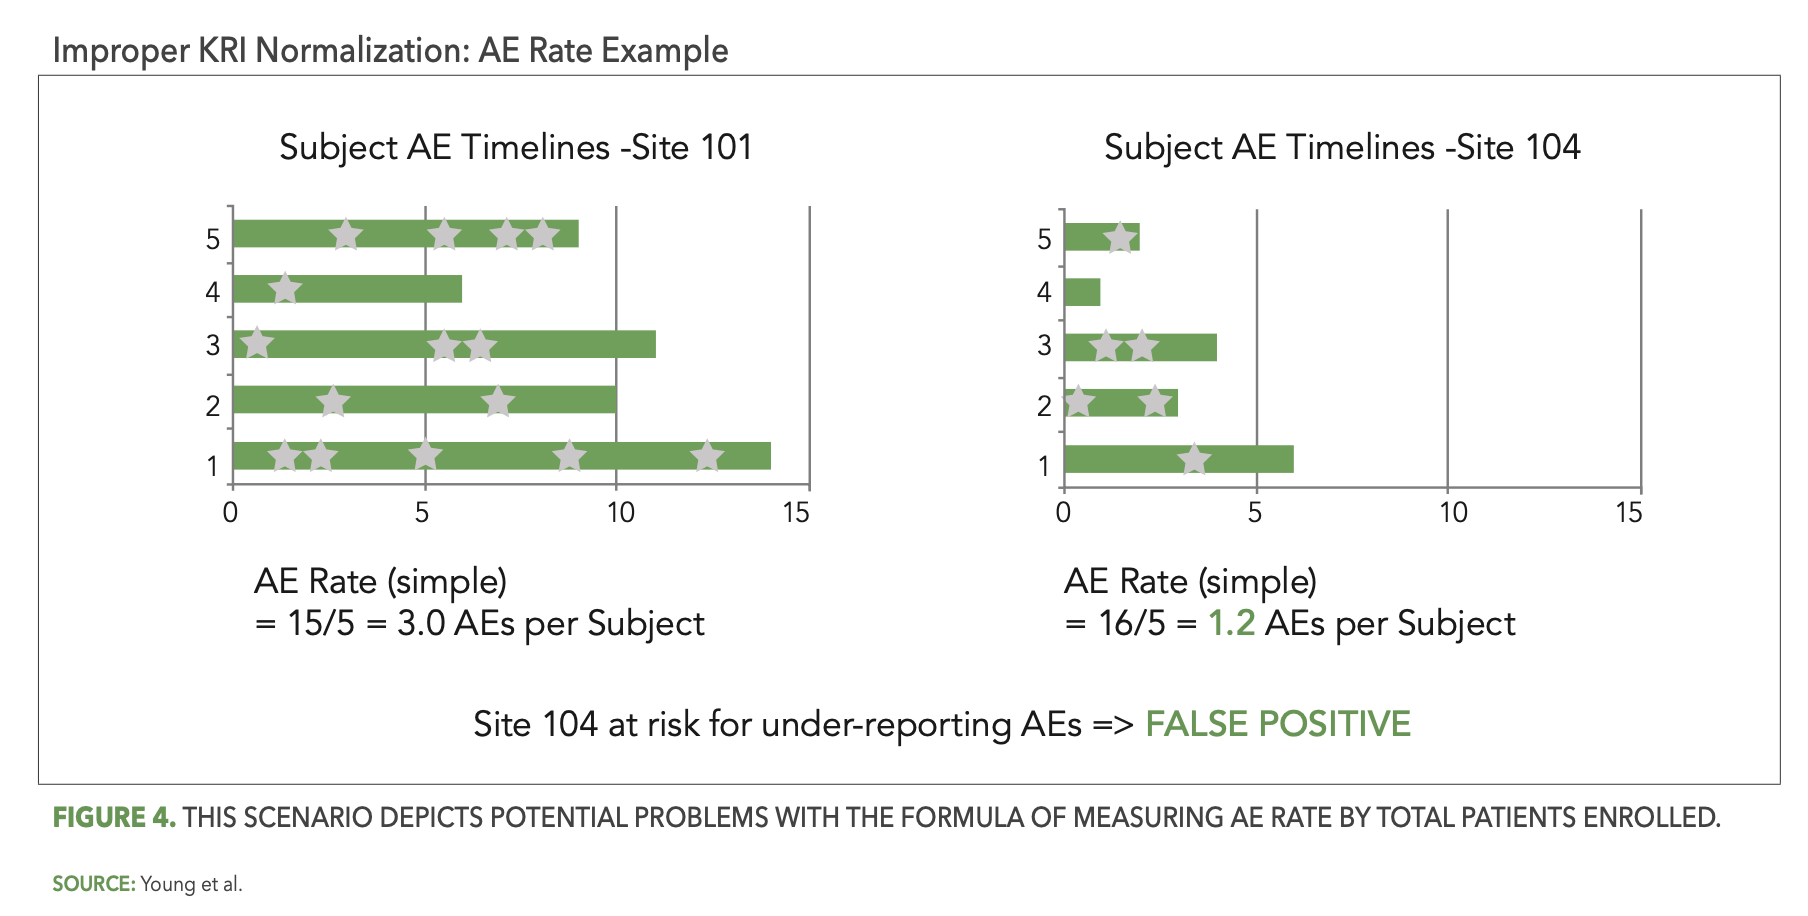
The thoughtful design and implementation of KRIs and QTLs is also critical. One important design consideration is how a KRI or QTL metric representing a rate is normalized. A good example to illustrate this is the KRI commonly used to detect sites that may be under-reporting or over-reporting adverse events (AEs) for their patients. Some teams have computed this KRI metric as the rate of AEs reported per enrolled patient at each site, expressed by the following simple formula:
AE Rate = (Total AEs Reported by Site) / (Total Patients Enrolled at Site)
Figure 4 below presents a scenario illustrating the problem with this formula. Two sites in a given study each have five patients enrolled, with one of them, site 101, reporting 15 AEs (signified by the stars) so far and the other, site 104, reporting only six AEs. Site 104’s computed rate of 1.2 AEs per patient is below the expected range and is flagged for potential under-reporting of AEs. However, patients at site 104 were enrolled more recently than the patients at site 101, so that the average patient follow-up duration is currently much shorter at site 104. The opportunity to observe AEs is, therefore, also much lower at site 104 and it is perfectly reasonable to expect fewer reported AEs for their five patients. The AE Rate KRI has incorrectly—and unnecessarily—generated a false positive risk signal for site 104.


An improved definition of the AE Rate metric will incorporate a relevant measure of patient participation time, such as the following:
AE Rate = (Total AEs Reported by Site) / (Total Patient Visits Conducted at Site)
Another important best practice consideration in the design of KRIs relates to their ability to detect an emerging issue at a site that may not have been occurring there previously. We use as an example of another commonly used KRI assessing the timeliness of entering patient data into the study case-report forms (eCRFs). This can be referred to as the “Visit-to-eCRF Entry Cycle Time” KRI. It is well-known that a site may initially perform well on this expectation, reliably entering patient data into the eCRF within a couple of days following each visit. However, for various reasons the site may start to struggle at some point with timely entry. This could be just a natural lapse in entry diligence, a change in behavior due to staff turnover, a shortage due to staff attrition or increased activity at the site, etc. Whatever the cause, it is important to detect this emerging risk at the site as early as possible so that it can be addressed.
This KRI is often computed using the cumulative set of available eCRF entry cycle times for each site, going back to the beginning of their study participation. While this will accurately present the overall average cycle time performance for each site, it will not proactively detect a recent degradation in that site’s performance—simply because the contribution of the earlier “good” cycle time observations will keep the cumulative reported average cycle time at a lower level than it is currently. This will often result in the KRI risk threshold not being exceeded—and no risk signal being generated—for the problem site. This is a false negative situation that may persist for many months and even through the completion of the study.
The solution to this problem involves an assessment based on recent increments of each site’s KRI observations, to enable more effective and timely detection of emerging issues. Such an incremental assessment approach also enables more rapid and effective confirmation of the resolution of an identified issue following intervention. For example, a risk signal generated for a site with slow eCRF entry time will typically result in the site monitor discussing the observed issue with site staff who will then agree to address the problem. This same incremental assessment approach will enable a clear assessment and determination as to whether the site is now entering their patient data in a timely fashion. A cumulative assessment of V2ECT on the other hand will generally fail to enable this assessment. Study teams are left not knowing whether the issue can be considered resolved.
An additional good practice for centralized monitoring teams is to conduct a thorough review of the study data collection methods prior to the configuration of KRIs and QTLs. Some patient assessments may allow for two or more data collection modes, which result in assessment data delivered from different sources. Examples include the option to use central or local labs, and completion of questionnaires via paper or electronic device. It is imperative to ensure that the data from each source is integrated into the centralized monitoring platform and fully accounted for in relevant KRI and QTL calculations. Mistakes in this area will inevitably lead to a high degree of false signals, and most often false positive signals detecting a high rate of missed assessments or labs. Each of these examples and considerations illustrate the critical importance of thoughtful KRI and QTL design. Teams must carefully consider with each KRI or QTL how best to ensure early and reliable detection of emerging risks, and to minimize the opportunity for false signals.
Statistical data monitoring
Well-designed KRIs and QTLs are an important component of effective centralized monitoring, as they will enable detection of key risks identified by the study team during risk planning. Are these then sufficient to reliably detect all the important issues that will occur during a study? An analysis conducted on 281 studies across 20 organizations from the CluePoints RBQM platform revealed that about 58% of all risk signals confirmed as issues by the study team were detected by KRIs and QTLs, while the remaining 42% were detected using statistical data monitoring. This metric reinforces the high importance of KRIs and QTLs, but also that they are not sufficient in providing comprehensive detection of all study issues.
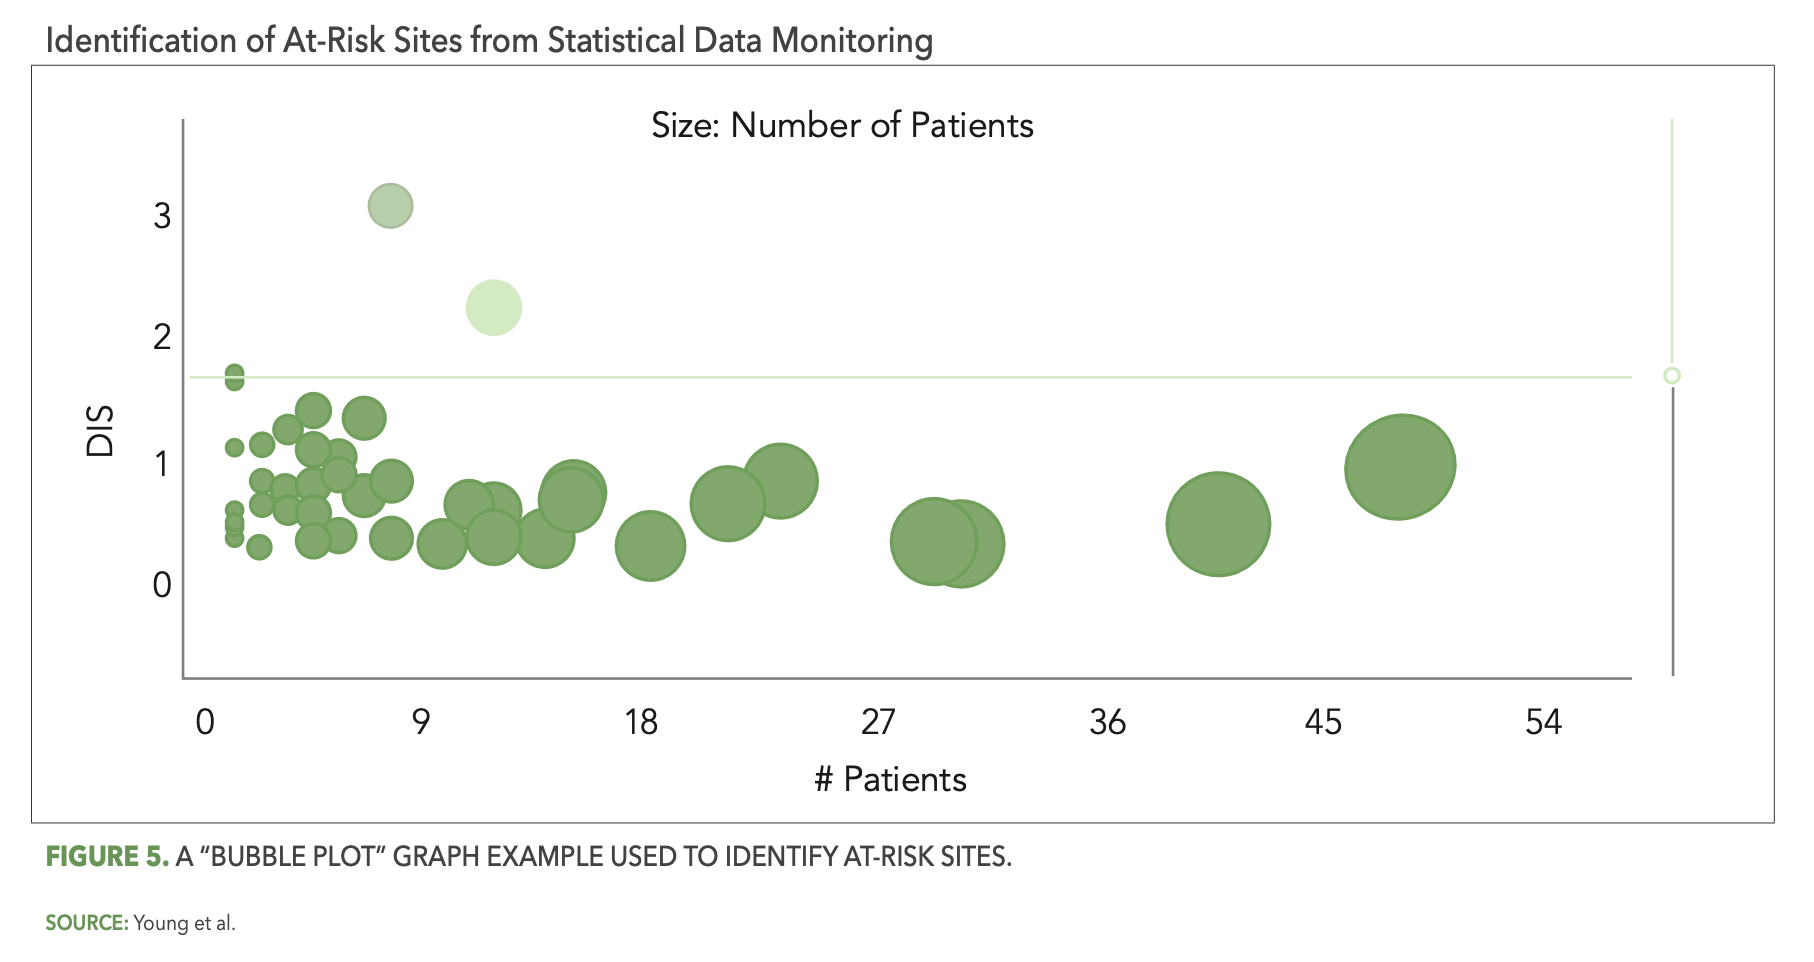
The CluePoints statistical data monitoring solution, referred to in CluePoints as Data Quality Assessment, or DQA, is comprised of a suite of advanced statistical tests designed to identify atypical patterns of clinical data that represent likely issues in the conduct of the study and/or reliability of the data. It is typically executed on most or all of the clinical data for a given study in an unsupervised manner—not guided by a prior assessment of study risks as is the case with KRIs and QTLs. An overall data inconsistency score (DIS) is computed for each site (or patient, country, etc.) in the study, representing a weighted average of all of the statistical tests executed on their data, which enables the study team to quickly identify and review the sites at highest risk. Figure 5 below shows a graph—referred to as a “bubble plot”—used to identify the at-risk sites. The vertical axis is the site’s DIS score, so that the sites (bubbles) highest on the plot represent the most at-risk sites across all of the statistical tests. The horizontal axis—along with the size of each bubble—represents the number of patients enrolled at each site.


There are several reasons why statistical data monitoring is so effective at detecting issues that are not identified by KRIs or QTLs. Among them is the simple fact that pre-study risk assessments—even when conducted very thoughtfully—will not identify all the likely sources of risk and error for a given study. It is inevitable that unexpected errors will occur among all the participants and activities in a clinical trial, due to factors ranging from lack of training or experience, misunderstanding, sloppiness or inattention, malfunctioning technology, and even intentional misconduct in the worst cases. A QTL or KRI may be designed, for example, to ensure that the number of missed endpoint assessments or visits is kept to an acceptably low level, but it will not, at the same time, be effective at ensuring that the endpoint assessments were performed properly resulting in reliable outcomes. An effective statistical data monitoring approach will automatically evaluate and detect likely systemic issues in data reliability in the form of unusually low or high variability in values, atypically low or high average scores, a preponderance of outlier values, etc.
Study team risk review and risk communication
The earlier sections have reviewed important best practice considerations to improve the reliability of risk detection. However, as mentioned, the effectiveness of centralized monitoring depends on a second important factor as well—the ability of the study team to successfully assess and determine the root cause of each risk signal, and to address the confirmed issues effectively.
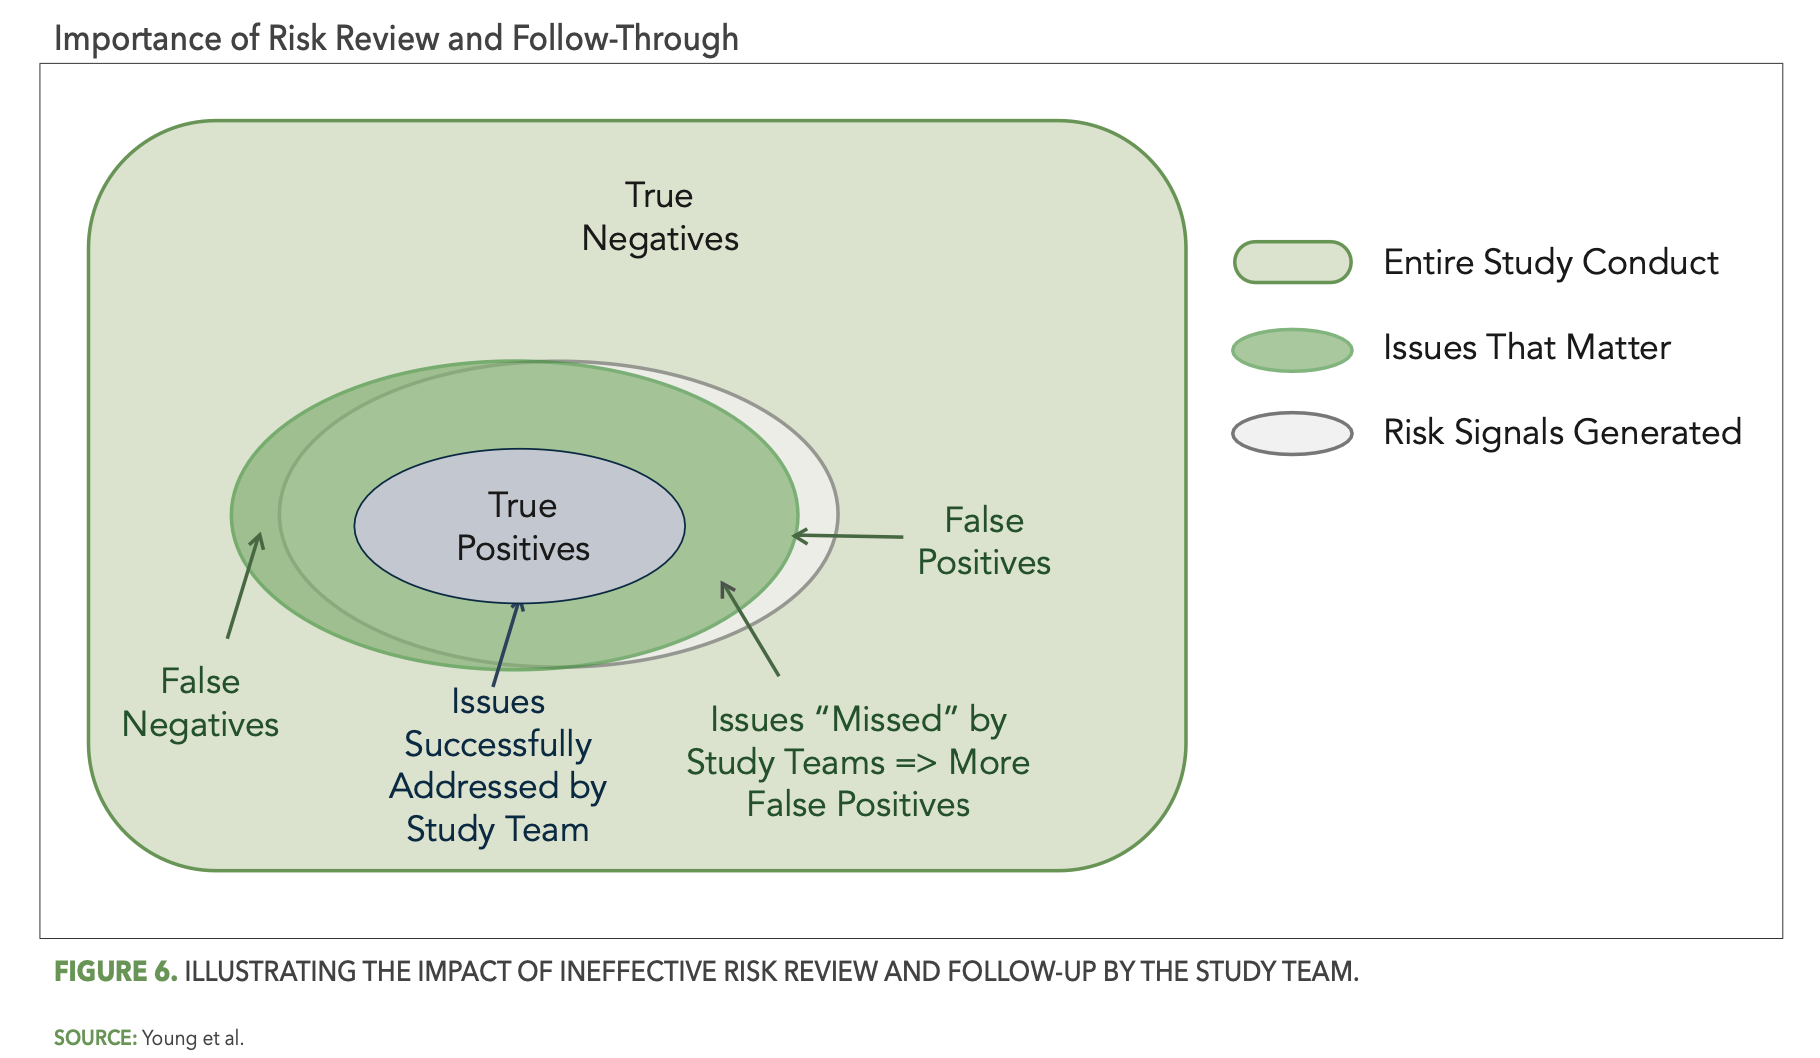
Reliable detection of risks by your central monitoring reviews will point your central monitors and study team to the issues that matter, but if those issues are not properly recognized and acted upon, the result is the same as if they had not been detected at all. Figure 6 below illustrates the impact of ineffective study team risk review and follow-through. In particular, the smaller blue oval represents the portion of detected issues that were successfully addressed by the study team. The overlap area outside of the blue oval then represents all the detected issues that the study team failed to address—effectively changing them from true positives back to false negatives.


The dynamics that can lead to ineffective follow-up are numerous. In one example, a site in a large dermatology study was flagged as high risk across a number of KRIs and statistical data monitoring tests. The following are a few of the specific risks detected:
- Average time to complete key endpoint assessments was extremely low compared to overall study average.
- Patient endpoint assessments conducted at the same visits were inconsistent with each other at a very high rate (90% of the time).
- Patient endpoint assessment scores were propagated across patient visits at a high rate.
These findings were shared by the centralized monitoring team with the site management team, with instruction to investigate and confirm root causes and any corrective actions required. The responsible site monitor responded that these centralized monitoring risks did not represent real issues, as they were monitoring the site frequently and had observed that everything was being done appropriately. This assertion was initially accepted by the central monitor and the risk was officially closed as a “non-issue.” One of the study team members was not comfortable with this conclusion however, and performed some additional investigation of the site data, which further confirmed and reinforced the initial centralized monitoring findings. This led to additional for-cause visits to the site and discovery of some significant issues in study conduct. If it had not been for the due diligence of this one study team member, the study conduct issues at this site would have persisted indefinitely and much of the primary endpoint data at this site would have been unreliable. It would have become a highly impactful false negative.
Another general example relates to the AE Rate KRI, where follow-up by the site monitor frequently fails to confirm that an issue exists. This may be due to the investigation being limited to a review of some patient source records that don’t reveal any missed AEs. A more thorough follow-up is likely required in these cases, such as a review of the data patterns that may indicate lapses in AE records collection, a review and discussion of the site process for AE reporting, and assurance of the principle investigator’s understanding of AE definitions for the protocol.
Some study teams and organizations are more effective than others at risk follow-up. There are several important keys to ensuring success:
- Identify and include all relevant stakeholders across the organization in centralized monitoring implementation from the beginning. Encourage appropriate cross-functional involvement and ownership, including the relevant functional leaders.
- Identify champions within each functional group that will help to train and mentor colleagues and promote the importance of centralized monitoring.
- Implement a cross-functional awareness and training program that includes strong focus on critical thinking skills and the root-cause analysis methods that enable effective risk triage.
- Establish best risk management practices focusing on the risk review flow, cross-team and cross-functional learning, and continuous improvement.
Active cross-functional engagement and a commitment to critical thinking and root-cause analysis are essential to effective risk review and follow-up. It may be valuable especially in the earlier stages of centralized monitoring adoption to include a quality representative in regular risk-review meetings, who can support the team in adhering to disciplined root-cause thinking. Communication and analytics are paramount to an effective RBQM strategy. Messages conveyed by the central monitor have significant impact on the team’s understanding of the risks, root-cause analysis flow, and the ultimate confirmation of actual issues. It is, therefore, essential for central monitors to develop best communication practices and critical thinking skills.4 It will not only provide central monitors with the tools necessary to guide study teams in effective root-cause investigation and risk mitigation, but also give them greater confidence in being persistent with colleagues to ensure that risk follow-ups are appropriate and well-documented.
Conclusion
The overall goal of centralized monitoring—and of RBQM more broadly—is to improve study quality. Three components are critical to achieving this goal:
- Quality by design and study risk planning – reducing the opportunity for errors that matter to occur.
- Centralized monitoring – reliably detecting and addressing emerging issues by minimizing the occurrence of false signals.
- Continuous improvement – the ability to learn from centralized monitoring outcomes and feed that knowledge back into an evolving RBQM strategy.
Understanding the achievement of study quality as the eradication of false positives and false negatives provides a valuable conceptual framework to help organize and guide your team’s implementation of centralized monitoring. It must be implemented thoughtfully, supported by the right technology, risk detection methods, and best practice considerations. It must also include active cross-functional engagement and ownership of the process, supported by a culture of critical thinking and root-cause assessment methods. And it is important to carry risk-review discussions beyond the routine centralized monitoring meetings. A periodic review of the risk review and follow-up process should be conducted to evaluate its effectiveness in confirming and resolving issues that matter, to enable continuous learning and improvements in the approach.
Steve Young, Chief Scientific Officer, CluePoints, Dan Beaudry, Senior Vice President, Customer Success, CluePoints, Vera Pomerantseva, PMP, Risk and Quality Management Lead, ZS, and Jonathan Rowe, Principal - Head of R&D Quality and Operations Risk Management, ZS
References
- US Department of Health and Human Services, Food and Drug Administration. Guidance for Industry: Oversight of Clinical Investigations – A Risk-Based Approach to Monitoring [Internet]. 2013. Available from: https://www.fda.gov/media/116754/download
- Sacks L, Shamsuddin H, Yasinskaya Y, Scientific and Regulatory Reasons for Delay and Denial of FDA Approval of Initial Applications for New Drugs, 2000-2012. JAMA. 2014; 311(4):378-384. Available from: https://jamanetwork.com/journals/jama/fullarticle/1817795
- International Council for Harmonisation of Technical Requirements for Pharmaceuticals for Human Use. ICH Harmonized Guideline: General Considerations for Clinical Studies: E8(R1). 2021.
- Pomerantseva V, Developing Critical Thinking Within Centralized Monitoring Teams. Applied Clinical Trials. 2021. Available from: https://www.appliedclinicaltrialsonline.com/view/developing-critical-thinking-within-centralized-monitoring-teams


")


Newsletter
Stay current in clinical research with Applied Clinical Trials, providing expert insights, regulatory updates, and practical strategies for successful clinical trial design and execution.


Unifying Industry to Better Understand GCP Guidance
May 7th 2025In this episode of the Applied Clinical Trials Podcast, David Nickerson, head of clinical quality management at EMD Serono; and Arlene Lee, director of product management, data quality & risk management solutions at Medidata, discuss the newest ICH E6(R3) GCP guidelines as well as how TransCelerate and ACRO have partnered to help stakeholders better acclimate to these guidelines.

Managing Side Effects and Dosing in Off-Label GLP-1 Use with Help from Real-World Evidence
July 18th 2025Shipra Patel, global therapeutic area section head, endocrinology, global head, pediatrics, Parexel, explains how real-world data is helping researchers navigate gastrointestinal side effects, dose flexibility, and long-term tolerability in off-label GLP-1 use.


Anselamimab Misses Primary Endpoint in Phase III CARES Trials for AL Amyloidosis
July 17th 2025In the Phase III CARES trials, anselamimab did not meet the primary endpoint for advanced-stage AL amyloidosis, but a prespecified subgroup analysis revealed meaningful improvements in survival and cardiovascular outcomes.